
GMB Reporting Software — Client-Ready Performance Reports From One Dashboard
You're managing 5, 10, or 20 Google Business Profiles. Every month, every client expects a report that proves their GBP is working. But logging into Google's dashboard per client, screenshotting metrics, and reformatting everything into something presentable—that's a full day (or more) you don't have.
Surfa's GMB reporting software pulls your clients' key performance metrics into one clean dashboard. Search visibility. Profile views. Calls. Website clicks. Direction requests. Engagement trends over time. Filter by any date range. Export in one click. No more manual data-pulling.
Start My 14-Day Free Trial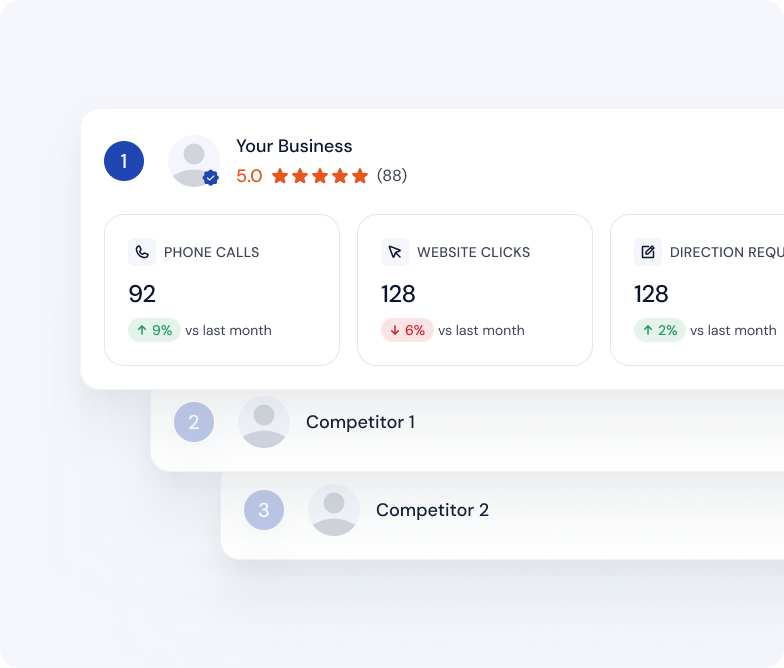
The Freelancer's Reporting Day Problem
Here's the routine you know too well: log into Client A's GBP. Navigate to insights. Screenshot visibility numbers. Screenshot profile views. Screenshot the Search vs. Maps breakdown. Note the calls, clicks, and direction requests. Paste everything into a document or slide. Add commentary. Log out. Repeat for Client B, C, D, and E.
Do that for 10 clients every month, and you've lost a full day—sometimes two. Do it for 20, and you're spending an entire week of your month just on reporting.
You're not skipping reports because you don't see their value. You're dreading them because the manual process is brutal, repetitive, and eats time you should be spending on strategy.
GMB Reporting Software Built to Show Clients Real Results
Surfa's GMB report generator consolidates the exact engagement metrics Google itself tracks—into a clean, client-facing view.
You get a dashboard with everything you need: Search Visibility, Google Profile Views (broken down by Search vs. Maps), Phone Calls, Website Clicks, Direction Requests, and an Engagement Over Time chart that shows trends across your selected period.
Filter by any date range. Export the report. Send it to your client. No manual data-pulling. No formatting. No screenshots.
What Your GMB Performance Report Includes
Search Visibility
Total views for the selected period. This tells a client how often their business appeared in Google Search and Maps—the raw number that shows whether their GBP is getting seen at all.
Google Profile Views (Search + Maps)
Views are broken down by Search vs. Maps so you—and your client—know where visibility is coming from. Strong Maps views? They're being found locally. Strong Search views? They're ranking for relevant queries. This breakdown gives context your client can actually understand.
Phone Calls, Website Clicks, and Direction Requests
These are the engagement actions that matter most to local businesses. Calls bring conversations. Clicks bring website traffic. Direction requests bring foot traffic. Tracking all three in one report shows your client exactly how their GBP is driving real business outcomes.
Engagement Over Time
The trend chart toggles between Profile Views and Actions (calls, clicks, and direction requests combined). Hover over any point to see exact daily figures. This visual makes it instantly clear whether a client's GBP engagement is growing, plateauing, or dropping—and you don't have to explain a spreadsheet full of numbers.
Why Freelancers Choose This GMB Report Generator
Any Date Range, One Click
Need to show this week's performance? Last month? The last 90 days? This year? The date range filter covers all of it with one click. No manually selecting date ranges in Google's dashboard, re-screenshotting, or re-exporting. Just select, view, export.
Export-Ready Reports for Every Client
One-click export gives you a clean, professional report without formatting work. No copy-pasting into your own template. No design tweaks. Just download and send. Your clients get a consistent, polished document every time.
No More Screenshotting Google's Dashboard
Google's own dashboard shows the data, but it's not client-friendly. It's not exportable in a clean format. It takes multiple clicks just to get to the numbers you need. Surfa packages it all into one view that's actually built for sharing.
Proof of Value That Speeds Up Renewals
Clients renew when they see results. A clean, data-backed report showing search visibility, calls, clicks, and direction requests is proof of value your clients can actually understand. When they see the numbers moving, they stay. And they're happy to keep paying.
Built for How Freelancers Actually Work
One Person, Every Client's Report Day
You don't have a reporting team. You don't have an assistant pulling numbers. You handle every client's report yourself. Surfa centralizes all of it—so you're not logging into 20 different dashboards every month.
Consistent Reporting Across 5 to 20 Clients
The report structure is the same for every client. Same metrics. Same breakdowns. Same visual format. Your consistency looks professional, and you're not rebuilding a new report template for every client every month.
From Raw Data to Client-Ready in Minutes
Select the date range. View the dashboard. Export. Send. That's it. What used to take a full day now takes minutes. You get your time back for strategy, execution, and actually growing your business.
Frequently Asked Questions
Search Visibility, Google Profile Views (Search + Maps breakdown), Phone Calls, Website Clicks, Direction Requests, and an Engagement Over Time trend chart showing Profile Views and Actions.
Click "Export Report." The dashboard generates a clean, client-ready report you can download and send directly.
Actions combine Phone Calls, Website Clicks, and Direction Requests into a single engagement metric. The chart toggles between Profile Views and Actions so you can see either volume or engagement.
Surfa pulls the exact same engagement data Google tracks, packaged into a client-ready dashboard. You can stop logging into Google's dashboard for reporting purposes—this gives you everything you need in one view.
Stop Building Reports From Scratch
Every hour you spend pulling data, screenshotting, and formatting reports is an hour you're not spending on strategy, client relationships, or growing your business.
Surfa's GMB reporting software gives you that time back. One dashboard. Every client. Every metric. Filter by any date range. Export in one click. Done.
Stop rebuilding reports. Start sharing results.